


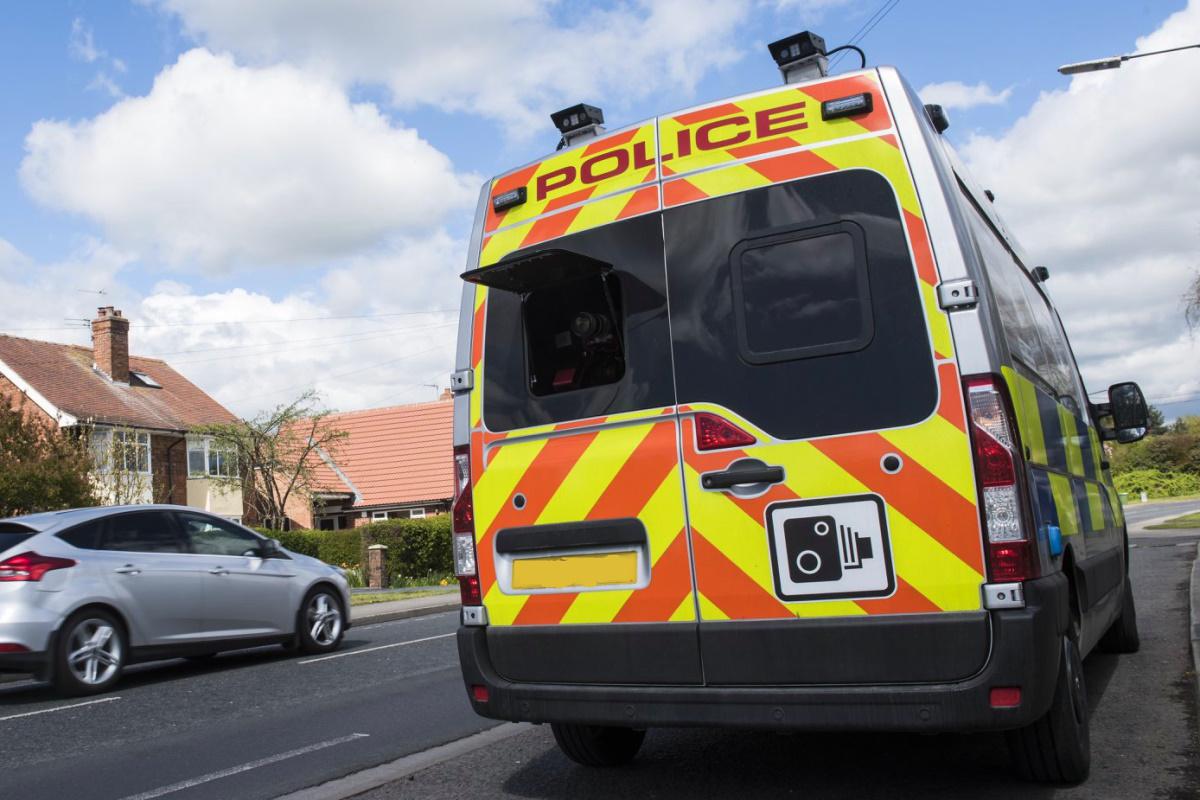
Analysis of UK speeding offence data ranks North Yorkshire as the third worst area for the number of speeding offences.
The study analysed the latest police force data from 2010 to 2020 on speeding offences for each region in England and Wales to establish where the speediest drivers commit their offences.
The data, analysed by the International Drivers Association found that Lincolnshire has the highest number of speeding offences with 5.43 per 1,000 people each year.
South Wales ranked second with 5.23 offences per 1,000 residents.
In third place is North Yorkshire, with an average of 3,774 speed limit offences per year from a population of 831,600, at an average of 4.54 speeding offences per 1,000.
|
Police force area |
Average number of annual speeding offences |
Number of speeding offences per 1,000 residents |
|---|---|---|
|
Lincolnshire |
4,164 |
5.43 |
|
South Wales |
7,030 |
5.23 |
|
North Yorkshire |
3,774 |
4.54 |
|
North Wales |
3,054 |
4.34 |
|
Dyfed-Powys |
2,266 |
4.33 |
|
Staffordshire |
4,816 |
4.23 |
|
West Yorkshire |
9,792 |
4.18 |
|
Lancashire |
6,088 |
4.02 |
|
Bedfordshire |
2,740 |
4.02 |
|
Cheshire |
4,157 |
3.89 |
At the other end of the scale, Durham has the fewest speeding offences committed on average each year, with just 0.95 per 1,000 people. The North East county also has the fewest total number of people being charged with speeding offences with just 609 on average each year.
Derbyshire has the second lowest number of speeding transgressions committed by drivers, at 1.24, with an annual average of 1,318 offences from a population of 1,064,000.
Wiltshire drivers receive an average of 921 speeding tickets each year, which equates to 1.27 offences per 1,000, the third lowest on the list.
Despite London having the greatest number of speeding offences overall at 13.973, the city has the sixth lowest rate (1.55/1,000) due to the greater number of drivers who live in the capital.
Commenting on the findings, a spokesperson from International Drivers Association said:
“This study offers a fascinating insight into the locations where drivers are more likely to put their foot down on the pedal and where more accidents may occur as a result. It will be interesting to see if these rankings change in the coming years as more schemes are implemented across the country to lower speeding limits in an effort to crack down on speeding violations.”
The IDA used the latest speeding offence data from data.police.uk spanning from 2010 to 2020 across each police force area in England and Wales to establish an annual average of speeding offences made. This was then cross referenced with population data from ONS in order to find the areas with the most speeding offences per 1,000 residents.

 Whitby MP Slams Inadequate Train Services As Among The Worst In The Country
 York And North Yorkshire Mayor Praises "Fantastic Progress" As Combined Authority Marks £124m Spend
 Football's Coming Home As Athletic Announce Return To Sports Village
 Ambitious Ten-Year Strategy Set to Revitalise North Yorkshire's Harbours
 Yorkshire Water Plans New Service Reservoir for Sandybed in Scarborough
 Steam Legend 'Tornado' To Return To North Yorkshire Moors Railway
 Whitby Town Sign Midfielder Sam Kay Ahead Of New Season
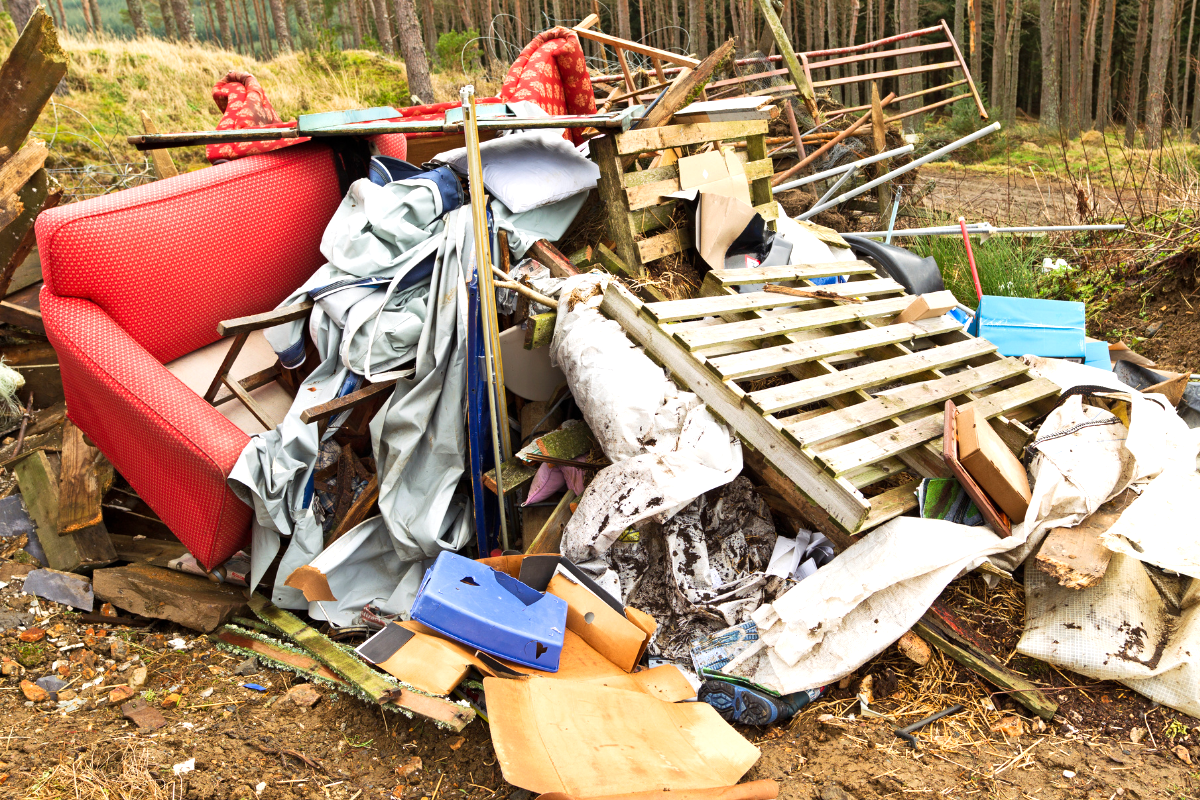 Fears Raised Over Fly-Tipping Following North Yorkshire Waste Centre Rule Changes
 Prime Minister Praises Scarborough And Whitby MP Over 'Mission Coastal' Initiative
 Scarborough Mayor Backs Fracking Principle But Opposes Burniston Gas Rig Plan
 Scarborough Athletic Release Retained List For 2026/27 Season
 Major Increase in Drug Offences Recorded by Police on North Yorkshire Coast


Comments
Add a comment